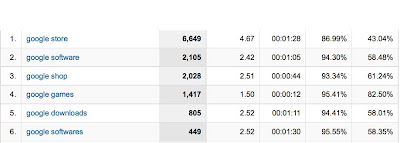
Search Engine Marketing Professional Organization (SEMPO)在3月23日发布的数据:
2008年搜索营销开支为134亿美元。2009年预计上升到147亿美元。长期预测到2013年搜索营销开支达261亿美元。
搜索引擎营销支出,2008年,单位:亿美元
|
对比以前的SEMPO数据,付费搜索广告所占的比例有所增加,SEO保持不变。
.jpg)

As I previously mentioned, on Friday I attended the Drizzle Developer Day at Sun in Santa Clara. While there I had the chance to speak to the group while everyone ate their salad, pizza, and cookies.
The talk was titles "What Craigslist wants and needs from Drizzle" and is available as a Google Docs presentation here. I've also embedded a version of the slides below.
I should note here, as I did at the talk, that this presentation is neither comprehensive or completely representative. That is to say that I'm sure there are things I've forgotten. Plus, the fact that I was working with MySQL in other high-volume web shops before coming to Craiglist means that there's definitely some personal bias and pet peeves addressed in there too.
Anyway, that's what I presented.
Thanks to the fine folks at Sun (soon to be Oracle) for hosting and organizing the day. And special thanks to the Drizzle developers for getting together and showing the rest of us how things work and taking time to talk about their plans.
(comments)
The 2009 Percona Performance Conference finished up last week, and was overall a resounding success. Thanks to all of the speakers, O’Reilly, and Sun/MySQL for help making it happen! Most slides have been uploaded; look for the stragglers over the next couple of days.
Entry posted by Ryan Lowe | No comment
Add to:  |
|  |
|  |
|  |
| 
We are at the beginning of the multicore era. Computers will have increasingly many cores (processors), but there is still no good programming framework for these architectures, and thus no simple and unified way for machine learning to take advantage of the potential speed up.
In this paper, we develop a broadly applicable parallel programming method, one that is easily applied to many different learning algorithms. Our work is in distinct contrast to the tradition in machine learning of designing (often ingenious) ways to speed up a single algorithm at a time.
Specifically, we show that algorithms that fit the Statistical Query model can be written in a certain “summation form,” which allows them to be easily parallelized on multicore computers. We adapt Google’s map-reduce paradigm to demonstrate this parallel speed up technique on a variety of learning algorithms including locally weighted linear regression (LWLR), k-means, logistic regression (LR), naive Bayes (NB), SVM, ICA, PCA, gaussian discriminant analysis (GDA), EM, and backpropagation (NN). Our experimental results show basically linear speedup with an increasing number of processors.
Read more about this study here (PDF - you can download also)
Scale-up solutions in the form of large SMPs have represented the mainstream of commercial computing for the past several years. The major server vendors continue to provide increasingly larger and more powerful machines. More recently, scale-out solutions, in the form of clusters of smaller machines, have gained increased acceptance for commercial computing.
Scale-out solutions are particularly effective in high-throughput web-centric applications.
In this paper, we investigate the behavior of two competing approaches to parallelism, scale-up and scale-out, in an emerging search application. Our conclusions show that a scale-out strategy can be the key to good performance even on a scale-up machine.
Furthermore, scale-out solutions offer better price/performance, although at an increase in management complexity.
Read more about scaling out/up and about the conclusions here (PDF - you can also download it)
| 四月 2009 | ||||||
| 一 | 二 | 三 | 四 | 五 | 六 | 日 |
| 1 | 2 | 3 | 4 | 5 | ||
| 6 | 7 | 8 | 9 | 10 | 11 | 12 |
| 13 | 14 | 15 | 16 | 17 | 18 | 19 |
| 20 | 21 | 22 | 23 | 24 | 25 | 26 |
| 27 | 28 | 29 | 30 | |||


